Data is becoming a strategic asset, but many businesses are still struggling with a series of reports, dashboards and analytical models that do not bring practical value. The problem lies not in the lack of tools, but in how to exploit and manage data. As a leader in corporate finance, today's CFOs must not only "read" data, but also turn data into a competitive advantage - through effective financial analysis strategies, linked to business goals and making decisions based on insight, not emotion.
This article will help CFOs equip their businesses with essential strategies to improve data quality and make impactful financial decisions based on information from Gartner.
Prioritize financial analysis management to improve business results
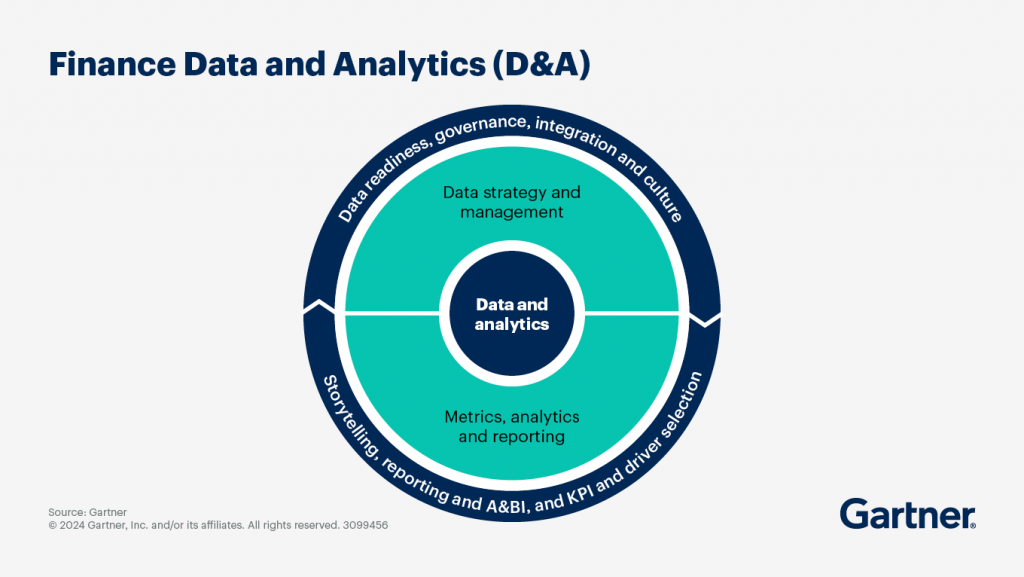
More than 1/3 of CFOs believe that Data quality is the main barrier to applying AI in finance. The most effective CFOs are those who Proactively build trust in AI by prioritizing data governance and analytics (D&A) from the beginning
Download the white paper “3 Core Principles of Data Governance and Analytics for CFOs” to discover:
- How CFOs Can Become Leaders in Enterprise-Level Data Governance Strategy
- How to Simplify and Optimize Data Governance Initiatives
- What Top CFOs Are Doing Differently to Unlock Data's Full Potential

Reevaluate your financial analysis strategy
To maintain competitive advantage and trend-setting, CFOs and finance leaders need to:
- Building a comprehensive and long-term AI strategy
- Attracting and developing the right talent for the data age
- Leverage financial analytics to drive business performance and smart decision making
An effective financial analysis strategy not only helps to “look back at the past”, but also to forecast the future and Proactively create better business results.
Metrics and Data Storytelling
Increase the impact of D&A by linking financial analysis investment to business results
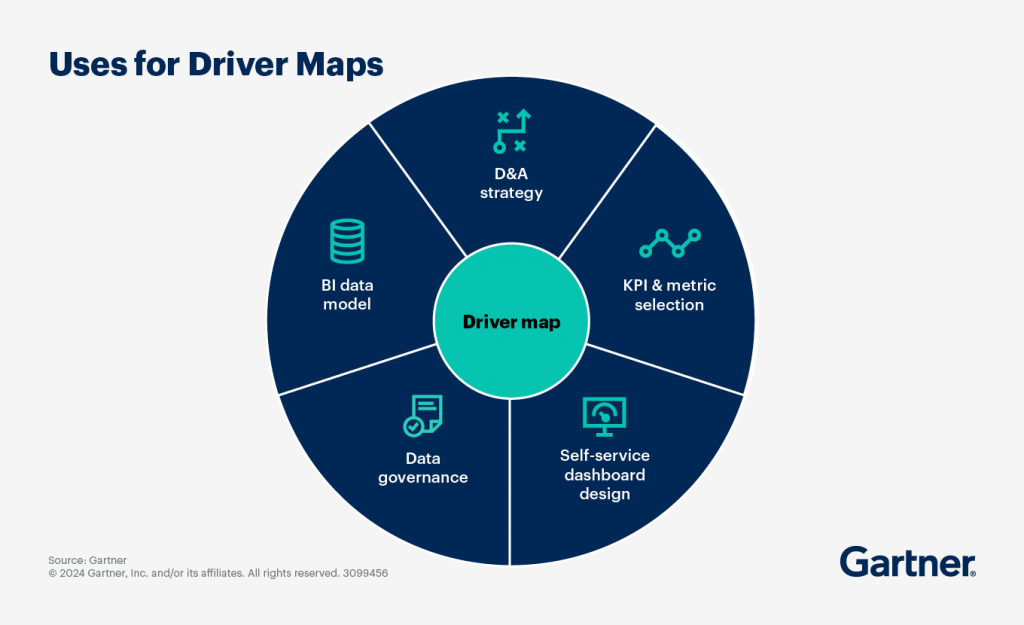
To deploy digital financial analytics capabilities, businesses need a clear approach to linking data and analytics (D&A) investments to specific business outcomes. Driver mapping (factor mapping) is a tool that helps connect FP&A activities with the actual information needs of decision makers.
Driver maps can be applied to a wide range of organizations, from complex enterprises, government agencies, and non-profits, to individual business units, operating regions, product lines, and projects.

Driver maps provide many values, including:
1. Clear D&A strategy
Driver maps help visualize how a business creates and transforms financial or strategic value. Through them:
- Identify high-value analytics projects that should be prioritized for investment
- Some FP&A teams also use driver maps to:
- Get feedback on analytical model design
- Training business leaders to make decisions based on a financial perspective
2. Choose appropriate KPIs and indicators
Not all metrics are KPIs. While KPIs are a type of metric, not all metrics are KPIs.
Leverage strategic insight and knowledge of your team's existing reporting systems to:
- Sketch out initial set of KPIs
- Discuss with the person responsible for business results and decision making leaders
This method helps:
- Easily engage stakeholders in the KPI development process
- Avoid getting stuck with too many unnecessary metrics
At the same time, practical considerations need to be taken into account when providing data:
- Driver maps help separate the questions “What to measure?” and “How to measure?”
- This helps to consider additional factors such as data quality, latency, complexity, and timing of information needs.
3. Design dashboards for self-service reporting
Visual dashboards are vital in self-service reporting systems.
- Driver maps can be the “skeleton” for dashboard design
- Each strategic or operational element can correspond to a separate tab or screen in the dashboard.
- The necessary data will be displayed in the appropriate context.
Driver map also helps:
- Shape the flow of information (drill-down, click-through)
- Reduce trial and error time and effort in editing dashboards later
4. Build a logical data model
A driver map is essentially an exercise in analyzing the relationships between data and information sources needed to generate a report. When sharing with an IT partner:
- Driver map becomes the blueprint for the data model that is suitable for the end user
- Helps organize data lineage in a more organized and manageable way
5. Effective data management
Driver maps are powerful tools in data governance that help identify and prioritize business outcomes, decision-making models, D&A processes, and data assets that need quality improvement.
From there, help the FP&A team:
- Clearly explain to business leaders the real value of data governance
- Connecting governance with real-world operations
Financial Report
Rethink dashboard design to create high-value financial analysis experiences
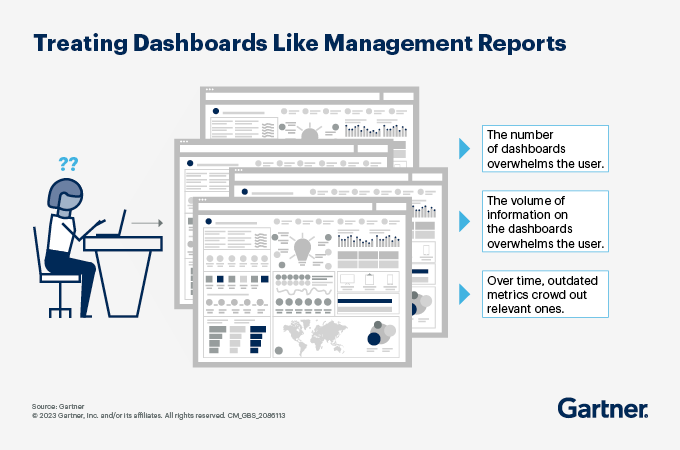
In reality, many dashboards fail to live up to their original promise of delivering information quickly and concisely to support business decision making.
Senior finance leaders recognize that current financial analytics dashboards are not improving decision quality because they are often too cumbersome, difficult to use, and overwhelming users with too much information.
To design effective dashboards, finance leaders should follow three core principles:
1. Clearly distinguish between dashboards and traditional management reports
Dashboard is a data visualization tool that helps track, analyze, and display key performance indicators (KPIs), metrics, and information that are important to monitor the health of a business, department, or process.
Unlike traditional management reports, dashboards:
- Updated regularly
- Cater to a wider audience in specific situations
- Allows users to interact directly with data
FP&A leaders need to clarify this distinction and provide specific guidance to analysts on when to use dashboards and when to use traditional reports. For example:
- In case of analysis for one-time request: use report
- In case the data needs to be updated regularly and in a timely manner: use dashboard
2. Design dashboards as a solution to a business problem
Each dashboard creation request should be viewed as an opportunity to dig deeper into the problem the decision maker is facing.
To understand how decision makers think when asking for data, analysts can:
- Direct exchange at the time of receiving request
- Or spend more time interviewing to clarify
During the interview, ask open-ended questions to clarify the primary and secondary factors that influence the problem the decision maker is trying to solve.
3. Maintain the relevance and effectiveness of the dashboard
Over time, dashboards tend to “bloat” because:
- New indexes are constantly being added
- Old, invalid indexes are not eliminated.
Therefore, FP&A department heads need to guide their analysts on how to:
- Avoid information overload
- Keep your dashboard on target and relevant to your users
Specifically:
- Instructions on how to remove rarely used indicators
- Track dashboard usage to see what needs improvement or elimination
Advanced financial analysis
Understand predictive analytics and action-oriented analytics application scenarios
In context:
- More and more data
- Business models are increasingly complex
- Increasing uncertainty
Businesses need to move quickly from manual analytics to advanced analytics and augmented analytics.
This requires careful process design to:
- Make the most of digital capabilities
- Ensure the output of machinery is of high quality and reliability

Predictive and predictive analytics are at the heart of this transformation.
These two types of analysis are based on:
- Artificial Intelligence (AI)
- Machine Learning (ML)
And is a field of strong investment in corporate finance.
However, each type of analysis requires:
- Different levels of technical expertise
- Different human skills
- Appropriate organizational structure
- Appropriate FP&A department maturity
AI/ML technologies are taking financial analytics to the next level.
The four main levels in advanced financial analysis:
Descriptive Analytics
Answer the question: “What happened?”
Rely on historical financial data to identify trends, monitor financial health, and support decision making based on past performance.
Diagnostic Analytics
Answer the question: “Why did that happen?”
Use techniques like drill-down, data mining, data exploration and correlation to analyze the cause.
Predictive Analytics
Answers the question: “What will happen?” (or more specifically: “What is likely to happen?”)
Using techniques such as regression analysis, forecasting, multivariate statistics, pattern recognition, predictive modeling.
This type of analysis has been implemented by many businesses using their own available human resources and technology.
Prescriptive Analytics
Answer the question: “What should we do to make that happen?”
Apply techniques such as graph network analysis, simulation, complex event processing, neural networks, recommendation engines, heuristics, machine learning.
This type of analysis requires additional resources such as personnel, technical training, and investment in new technology to implement effectively.
When building an advanced analytics strategy, consider the following questions:
- What financial analytics capabilities should we invest in?
- How to build the right AI strategy for your finance department?
- What are the most effective AI application scenarios in finance?
- How should we use AI/ML to drive advanced and predictive analytics?
- How to evaluate and measure ROI for financial analytics initiatives?
Data & Analytics Governance (D&A Governance)
The Role of AI Technology in D&A Management for Financial Analytics
By 2028, 60% financial leaders in the financial planning and analysis (FP&A) sector will use artificial intelligence (AI) technology for data governance and analysis (D&A).
However, assessing the true value of D&A management technologies is challenging, given the constant emergence of new use cases for AI and the evolving technologies themselves.
It is important to distinguish between what is just “hype” and what is real. Some technologies are innovative but still in their early stages, while others have reached a level of maturity that allows them to be widely used in practice.
Innovations in D&A management using AI help FP&A leaders achieve four key goals:
1. Improve data integrity and quality
AI is powerful when it comes to high-quality data, and it helps FP&A leaders and their teams address issues like inaccurate, inconsistent, and duplicate data.
Solutions that integrate functions such as:
- Anomaly detection
- DataOps
- Data observability
…helps ensure data consistency, accuracy, and integrity across the enterprise, thereby promoting data democratization – that is, empowering more departments to use data.
2. Drive unbiased decision-making through AI and proactive D&A governance
AI helps automate knowledge-based tasks, thereby minimizing the risk of bias in decision-making, while shifting the human role to confirming and correcting decisions made by AI.
Some of the prominent technologies in this field include:
- Explainable AI
- Semantic search
These technologies help finance leaders understand the origins of data, algorithms, and models used to generate insights, thereby reducing the risk of making decisions based on opaque information.
For AI to be truly effective, businesses need to build more proactive and advanced D&A policy frameworks and governance processes, ensuring data is ready for AI applications.
3. Ensure ethical development and operation of AI
As AI becomes a core element of business operations, FP&A leaders face the challenge of managing AI effectively and ethically.
Technologies such as:
- AI Governance
- Responsible AI
…supporting finance leaders to ensure transparency and accountability at all levels of the organization, particularly in investment decision-making and risk management related to AI applications.
4. Promote “data-centric” thinking and develop digital skills
D&A management helps businesses:
- Building a culture of data-driven decision making
- Enhance digital capabilities for human resources
By clearly setting:
- Role
- Responsibility
- Data Usage Procedure
… businesses can foster a “data-driven decision-making” mindset throughout the organization.
Collaboration between finance teams and AI experts will help build solutions that are cross-functional, unbiased, and based on real data.
Investing in technology that supports a data culture is key. Programs:
- Data literacy assessments
- Responsible data management (stewardship programs)
…will help bridge the skills and technology gap, ensure access to high-quality data & analytics, mitigate risk, and maintain trust with business partners.
For financial analytics to truly create value, businesses need to start with a solid foundation: effective data management, appropriate metrics, and reporting systems designed to support decision making. When CFOs proactively lead their data and analytics strategies, they not only improve operational efficiency, but also unlock the ability to predict, adapt, and create sustainable competitive advantages in the digital age. This is no longer an option, but a prerequisite for smart and proactive corporate finance development.
Bizzi Vietnam will continue to accompany CFOs and finance teams on the journey of optimizing, automating and digitally transforming corporate finance.
Monitor Bizzi To quickly receive the latest information:
- Facebook: https://www.facebook.com/bizzivietnam
- Linkedin: https://www.linkedin.com/company/bizzi-vietnam/
- Youtube: https://www.youtube.com/@bizzivietnam


