What is Financial Statement (FS)? The Role of Excel in SMEs Accounting
Financial statements are a system of accounting documents that generally reflect the financial situation, business results and cash flows of an enterprise in an accounting period. For enterprises that have not invested in specialized accounting software, Excel is the ideal starting tool to synthesize data from journals, ledgers and balance sheets.
Advantages and Disadvantages of Preparing Financial Reports Using Excel
Using Excel to prepare financial reports brings many benefits but also comes with many potential risks that businesses need to be aware of.
Advantage
- Free and familiar: Excel is built into the Microsoft Office suite, helping businesses save on licensing costs and not requiring complex training.
- Flexible and highly customizable: Accountants have full control, can easily add or remove columns, rows, and customize formulas to suit the specific management of the business without being limited by a rigid template.
- Visual data control: Powerful calculation functions such as SUMIF, VLOOKUP, INDEX-MATCH and Pivot Table tools allow to automate complex calculations, present data clearly and minimize errors due to manual calculation.
Disadvantages
- High risk of error: A small error in data entry or formula setting can propagate and cause an entire report to go wrong. Troubleshooting is extremely time-consuming and labor-intensive, especially when cost data is entered manually from multiple invoice sources.
- Low data security: Excel files are vulnerable to loss due to hardware failure, viruses, or leaks when shared via email or USB. Sensitive financial data is not protected by advanced security layers.
- Time consuming manual updates: When there is a change in regulations (e.g. new Circular), accountants have to manually update the entire reporting form, increasing the workload and risk of non-compliance with the law.
- Low productivity: The process of consolidating data from multiple sources (invoices, statements, payroll) into a single Excel file is time-consuming and can easily lead to overload. This is the biggest bottleneck that solutions business cost management Modern times can be solved radically by automating input data collection.
Types of Financial Reports Required by Regulations (Circular 200/2014/TT-BTC)
A complete set of financial statements as prescribed by Vietnamese law must include four main components, which are closely linked together.
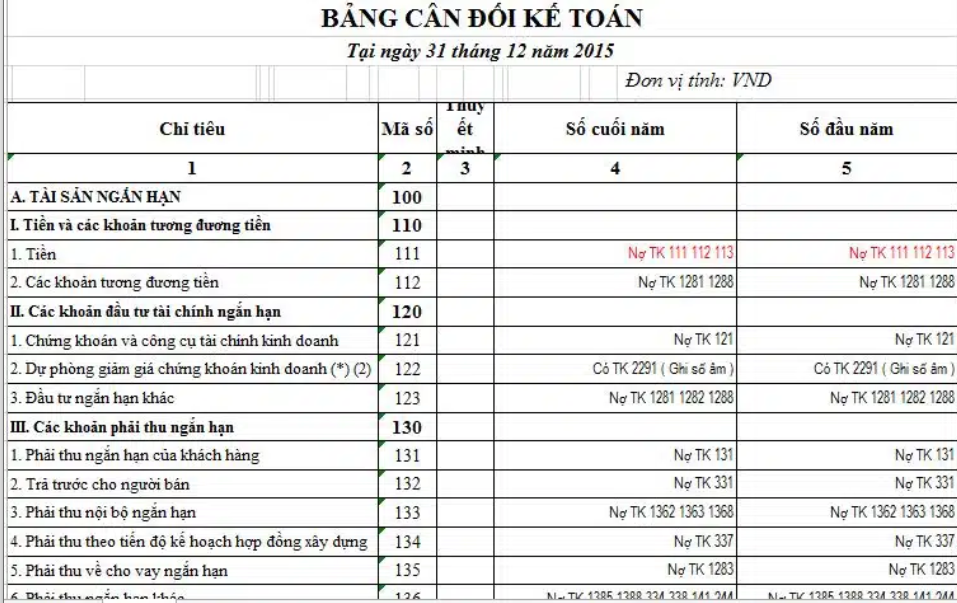
- Balance Sheet: Reflects total assets, liabilities, and equity at a given point in time, following the basic accounting equation: Assets = Liabilities + Equity.
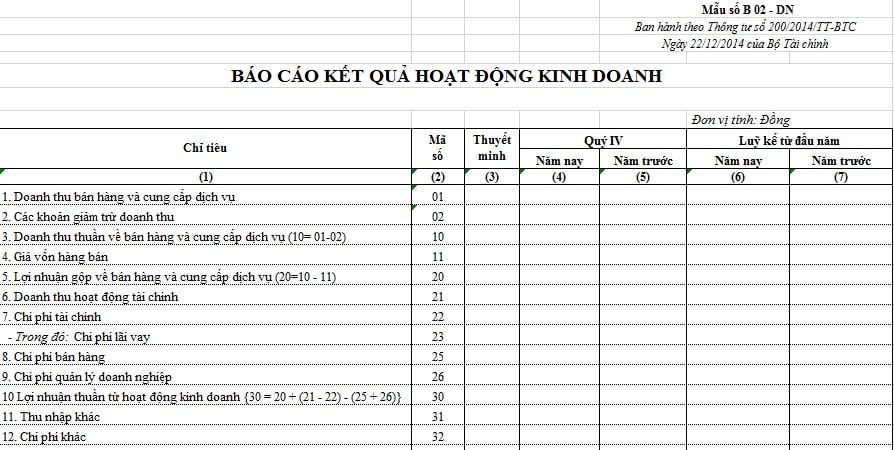
- Income Statement: A summary of a business's revenue, expenses, and profit (or loss) over an accounting period. Accurately recording these expenses is extremely important, as they directly impact profits and are often where errors arise when processing manual invoices.
- Cash flow statement (Cash Flow Statement): Provides information on cash inflows and outflows, classified by three main activities: operating, investing, and financing.
- Notes to the Financial Statements: Detailed explanations of the figures and accounting policies presented in the three reports above help readers better understand the financial context of the business.
What to Prepare Before Doing How to Make Excel Financial Reports?
To ensure accuracy, the data preparation stage is the most important step, determining the quality of the entire report.
1. Collect and systematize accounting data
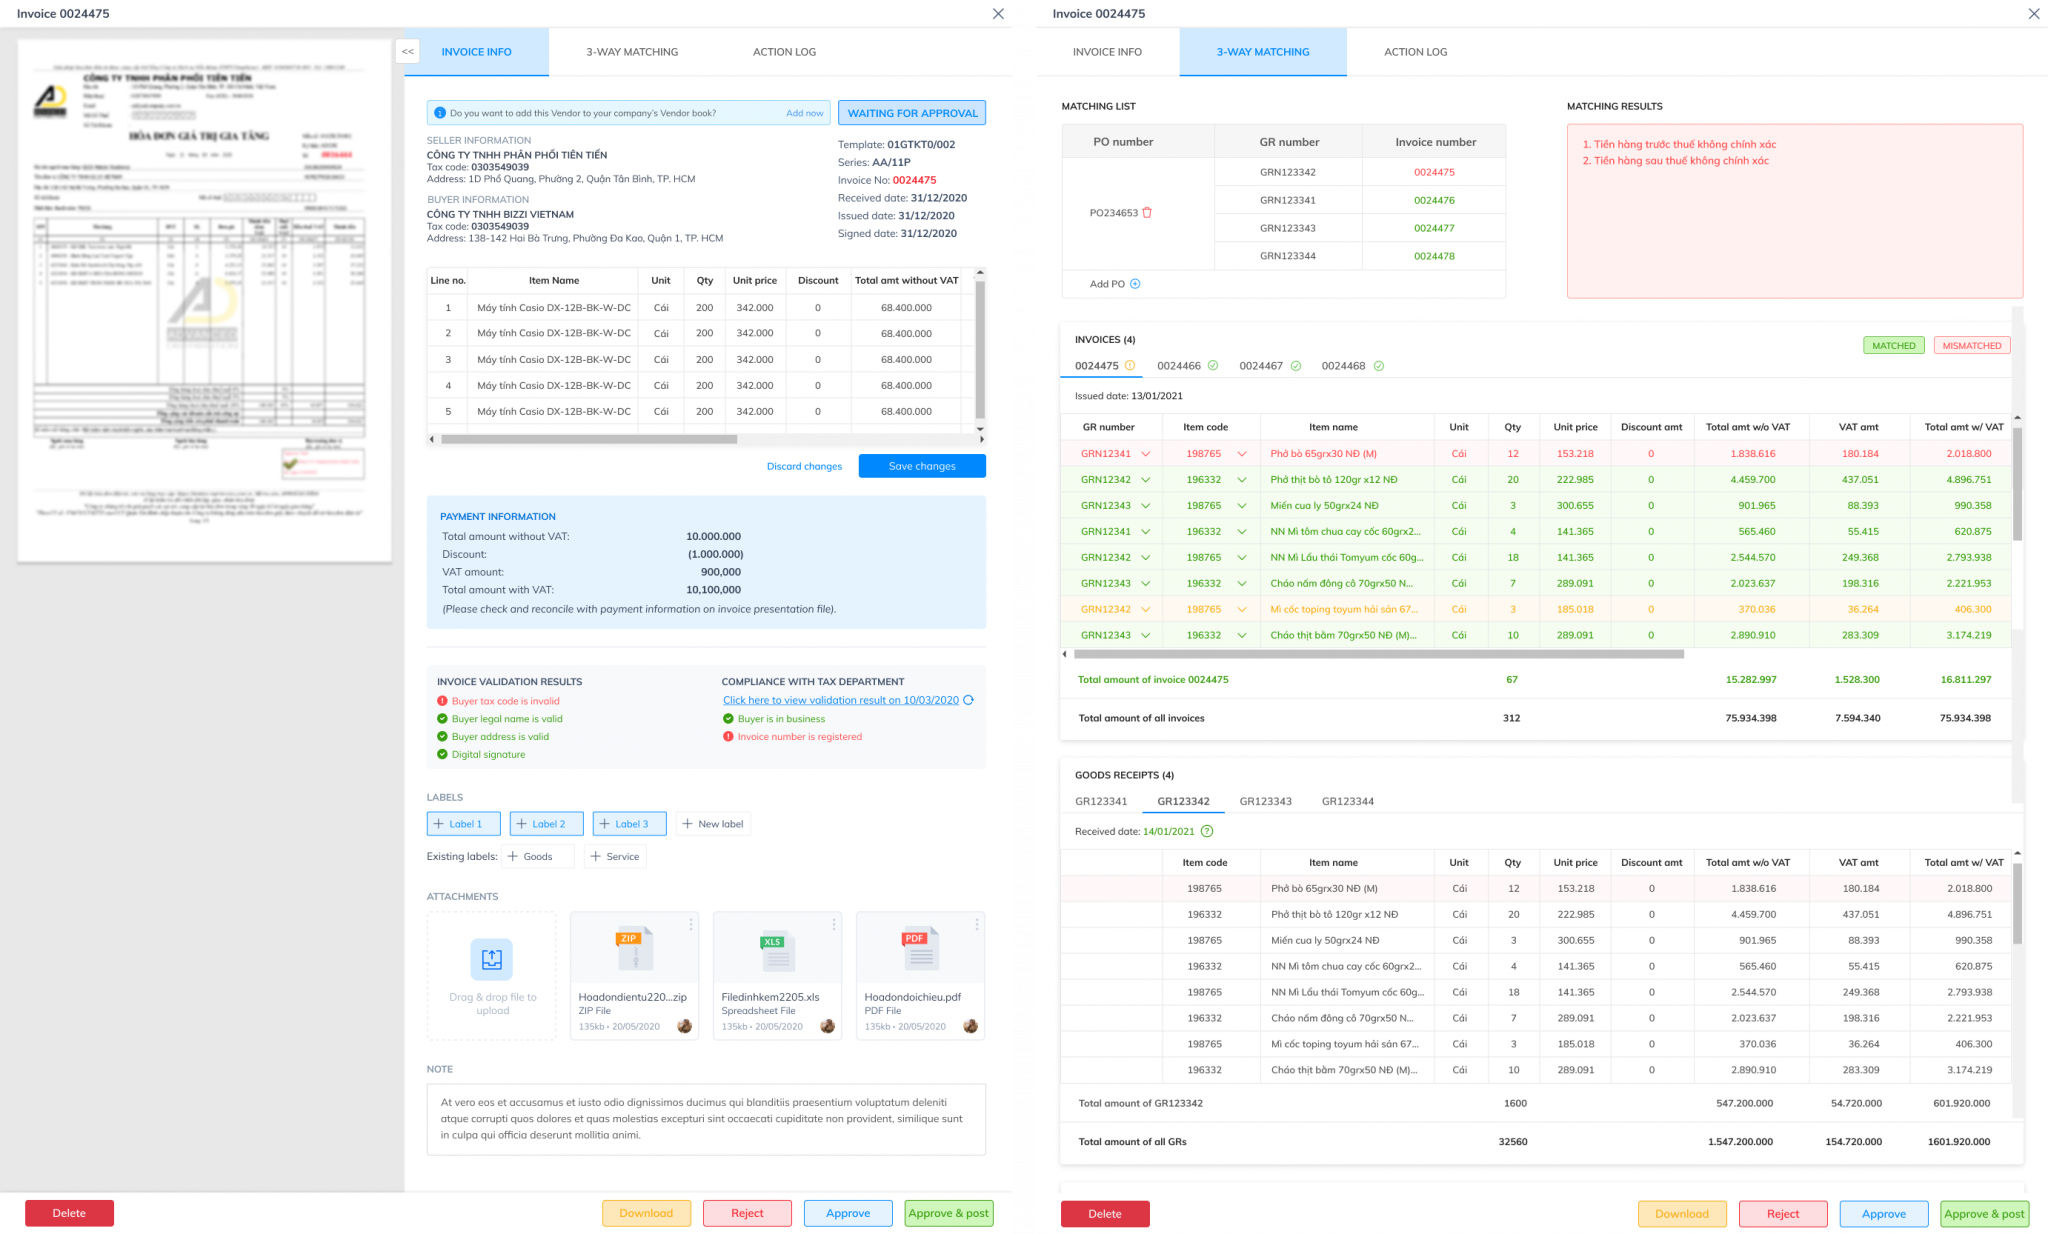
Gather all documents and books arising during the period, including: General Journal, Account Ledger, Balance Sheet, Invoice List, Payroll and related contracts. This process, especially the consolidation of invoices, is where the risk of error is highest. Therefore, applying technology to Automate input invoice processing Not only does it save time, it also ensures that the original data is always accurate before being uploaded to Excel.
2. Check and reconcile opening balance
Compare the ending balance of the previous period's financial statements with the opening balance in the books of the current period. Any discrepancies must be investigated and corrected immediately to avoid cumulative errors.
Instruct How to Make Excel Financial Reports [Step-by-Step]
Below are detailed instructions with specific numerical examples so you can practice right away.
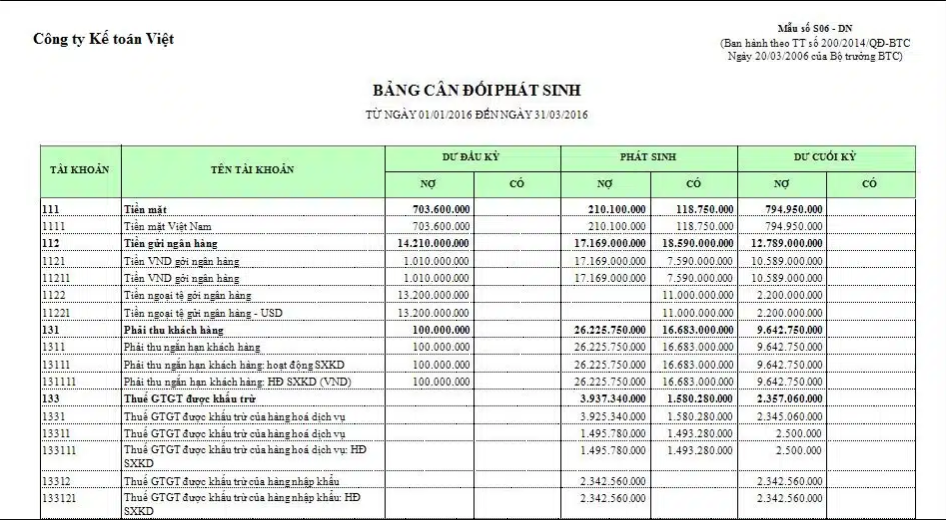
Suppose we have the following ending balance sheet:
| Account number | Account Name | Ending Balance (VND) |
|---|---|---|
| 111 | Cash | 50,000,000 |
| 156 | Inventory | 150,000,000 |
| 211 | Tangible fixed assets | 300,000,000 |
| 214 | Depreciation of fixed assets | (60,000,000) |
| 331 | Payable to seller | 80,000,000 |
| 411 | Owner's capital | 350,000,000 |
| 421 | Undistributed profit after tax | [Will be calculated from the Business Performance Report] |
| 511 | Sales revenue | 500,000,000 |
| 632 | Cost of goods sold | 300,000,000 |
| 642 | Business management costs | 70,000,000 |
1. Prepare Business Performance Report
Start with this report to determine profit, then transfer this figure to the Balance Sheet. The summation of expenses such as management expenses (account 642) will be much more accurate if the business has an automatic expense management system, instead of adding up from individual files.
| Target | Excel Formulas (Examples) | Value (VND) |
|---|---|---|
| Net revenue | =VLOOKUP("511", BCDPS!A:C, 3, FALSE) |
500,000,000 |
| Cost of goods sold | =VLOOKUP("632", BCDPS!A:C, 3, FALSE) |
(300,000,000) |
| Gross profit | =C2-C3 |
200,000,000 |
| Business management costs | =VLOOKUP("642", BCDPS!A:C, 3, FALSE) |
(70,000,000) |
| Profit before tax | =C4-C5 |
130,000,000 |
| Corporate income tax expense (assuming 20%) | =C6*0.2 |
(26,000,000) |
| Profit after tax (PBT) | =C6-C7 |
104,000,000 |

2. Prepare a Balance Sheet
Combine the ending balances of accounts from type 1 to type 4, ensuring that total assets equal total capital.
| ASSET | Value (VND) | CAPITAL SOURCES | Value (VND) |
|---|---|---|---|
| Cash (111) | 50,000,000 | LIABILITIES PAYABLE | |
| Inventory (156) | 150,000,000 | Payable to suppliers (331) | 80,000,000 |
| Tangible fixed assets (211) | 300,000,000 | TOTAL LIABILITIES | 80,000,000 |
| Depreciation of fixed assets (214) | (60,000,000) | EQUITY | |
| Owner's capital (411) | 350,000,000 | ||
| Undistributed net profit (421) | 104,000,000 | ||
| TOTAL OWNER'S EQUITY | 454,000,000 | ||
| TOTAL ASSETS | 434,000,000 | TOTAL CAPITAL | 534,000,000 |
| ASSET | Value (VND) | CAPITAL SOURCES | Value (VND) |
|---|---|---|---|
| Cash and cash equivalents | 50,000,000 | LIABILITIES PAYABLE | |
| Inventory | 150,000,000 | Payable to suppliers (331) | 80,000,000 |
| Fixed assets (residual value) | 240,000,000 | TOTAL LIABILITIES | 80,000,000 |
| EQUITY | |||
| Owner's capital (411) | 350,000,000 | ||
| Undistributed net profit (421) | 104,000,000 | ||
| TOTAL OWNER'S EQUITY | 454,000.000 | ||
| TOTAL ASSETS | 440,000,000 | TOTAL CAPITAL | 534,000,000 |
Note: The above example is intentionally misleading to illustrate one of the biggest difficulties of how to make excel financial report: find and fix errors. In practice, you need to make sure the Balance Sheet is balanced before reporting.

3. Prepare Cash Flow Statement (Indirect Method)
This report starts with pre-tax profit and adjusts for non-cash income/expenses.
| Content | Value (VND) |
|---|---|
| Profit before tax | 130,000,000 |
| Adjustments for the following: | |
| + Depreciation of fixed assets | 60,000,000 |
| ± Change in receivables/payables (assumed) | (20,000,000) |
| = Net cash flow from operating activities | 170,000,000 |
| Cash spent on purchasing fixed assets (Investing activities) | (50,000,000) |
| Proceeds from borrowing (Financial activities) | 100,000,000 |
| = Increase/decrease in net cash during the period | 220,000,000 |
Common Errors When Preparing Financial Statements on Excel and How to Fix Them
- Error #REF! or #N/A: Usually happens when VLOOKUP, INDEX-MATCH formula does not find data or referenced cell has been deleted. -> How to fix: Double check the reference data range and search account code. Use the IFERROR function to return 0 instead of an error.
- Unbalanced balance sheet: Total assets ≠ Total capital. -> How to fix: Recheck the ending balance of all accounts, ensure that all figures are taken, check the totaling formula and ensure that the profit after tax has been transferred correctly.
- Wrong Yin/Yang sign: Mistakenly recording expenses, depreciation, or deductions as positive numbers. -> How to fix: Always follow the rule: Capital, Revenue have a positive balance on the Credit side; Assets, Expenses have a positive balance on the Debit side. When reporting, deductions (depreciation, cost of goods sold) must be shown in negative numbers or in parentheses.
Excel vs. Accounting Software: When Should Businesses Upgrade?
Excel is a great tool to start with, but it can start to show its limitations as your business grows. Consider upgrading to automation solutions like Bizzi if you experience the following signs:
- The number of monthly transactions and expense invoices exceeds 200-300 documents.
- It took more than 2 business days just to compare and compile cost data from invoices.
- Multiple people need to access and approve payments.
- Data errors often occur and are time consuming to correct.
- Demand complex cost management reports, in-depth real-time analysis.

Frequently Asked Questions (FAQ)
To make it easier for accountants and business owners to prepare financial reports on Excel, below are the most common questions and detailed answers. This section will quickly answer common problems, from checking for errors, complying with Circulars to choosing important Excel functions.
1. How to check errors on Excel financial statements in the fastest way
The quickest way is to use the Balance Sheet. Make sure Total Debit = Total Credit and Total Ending Debit = Total Ending Credit. If this sheet is balanced then your 90% report will be accurate.
2. Does the Excel financial statement file comply with Circular 200/133 of the Ministry of Finance?
Excel itself is just a tool. Whether the report file complies or not depends entirely on the person preparing the report. You must design your own form and indicators in accordance with the provisions of Circular 200/2014/TT-BTC or Circular 133/2016/TT-BTC. You can refer to the consolidated document on the Ministry of Finance's website to ensure compliance.
3. Which Excel function is the most important to use when preparing financial statements?
The three most important functions are: SUMIF(S) to summarize data based on conditions (e.g., the total of an account's transactions), VLOOKUP or INDEX-MATCH to pull balances from a detail ledger into a summary table, and PIVOT TABLE to create quick analytical reports.
Conclude
How to make Excel financial reports is a cost-effective and flexible solution for many businesses, but requires careful and time-consuming work, especially when collecting cost data. As businesses grow, moving to automated solutions to process input data is a natural step to optimize performance and minimize risk.
Bizzi provides a comprehensive financial management platform that automates processes from input invoice processing, expense management to debt collection. Our system does not completely replace Excel, but integrates to become a source of accurate and reliable input data, freeing accountants from manual tasks and errors, allowing them to focus on analysis and strategic advice.
Read more:


