
DPO (Days Payable Outstanding), or average number of days payable, estimates how long a business can maintain a debt to a supplier. The commonly used method is to divide the average trade payable by the value of purchases on credit or cost of goods sold for the same period, and then multiply by the number of days in that period.
For meaningful results, it's essential to choose the right accounts payable, the right denominator, and the right period. A high DPO may reflect favorable credit terms, but it can also indicate overdue debt; simply looking at this number isn't enough to conclude that a business is managing its cash flow well.
What is DPO and how does it differ from other bill payment terms?
DPO is an indicator calculated from aggregated data on accounts payable and purchasing activities over a period, measured in days. It helps accountants, purchasing departments, and financial managers track supplier credit usage, compare trends, and question payment schedules.
Trade payables are obligations arising from goods or services purchased on credit. For distinction from accounts receivable and other obligations, see the explanation of [specific obligations]. Accounts Payable in Accounting. DPO focuses on the payment side of the business to the supplier; the time it takes for the customer to pay is included in the DSO index.
A 45-day DPO (Deposit Order) does not mean that all invoices are paid exactly 45 days later, nor does it prove that any invoice is overdue. The payment deadline for each invoice depends on the contract, the start date of the deadline calculation, and the agreed-upon conditions. To determine overdue debt, the due date must be compared with the payment date or the reporting date.
This indicator is useful when tracking the same on-time payment rate, overdue debt value, payment discount, and cash forecast. Changes in DPO suggest issues that need investigation, rather than self-identification of the cause.
DPO calculation formula: Should you use credit or cost price?
DPO = Average Trade Payables ÷ Value of Credit Purchases within the Same Range during the Period × Number of Days in the Period
Average accounts payable = (Beginning balance + Ending balance) ÷ 2
When sufficient internal data is available, the value of purchases on credit linked to the accounts payable is selected to better reflect the basis of liability. Purchases paid immediately are not included in the denominator without considering the impact: the purchase value increases but does not create a corresponding accounts payable, resulting in a lower calculated DPO.
When analyzing publicly available financial statements without credit purchases, many documents are used. COGS (cost of goods sold) as a representative example.. The formula is then DPO = Average Accounts Payable ÷ COGS × Number of Days. It is important to note that this is DPO based on cost of goods sold, as goods purchased during the period and goods sold during the period may differ.
| Data is available. | Basis of calculation | Things to check |
|---|---|---|
| Detailed purchase and accounts receivable records. | Credit purchases belong to the group of suppliers being analyzed. | Type of transaction: cash payment, reconciliation of purchase/return/adjustment, and scope of accounts payable. |
| Financial report, lack of credit purchases. | COGS acts as the representative, clearly stating the method. | Inventory fluctuations, accounts payable for services, and differences in presentation. |
| Service businesses, small or unsuitable COGS | Data purchased on credit for services within the same scope. | Do not apply near-zero denominator machines; separate cost groups/suppliers to be tracked. |
Why are changes in inventory calculated differently in two different ways?
With a simple trading model, without other adjustments, total purchases can be estimated as follows: COGS + ending inventory − beginning inventory. However, this is still the total purchase amount and does not automatically become a credit purchase: the immediate payment portion needs to be excluded, and adjustments must be made according to the actual records.
Example: COGS is VND 12 billion, inventory increases by VND 3 billion, all purchases are made on credit and there are no other adjustments. Total credit purchases then amount to VND 15 billion. With an average accounts payable of VND 2 billion over 365 days, the DPO (Demand Payment Order) based on credit purchases is 48.67 days, while based on COGS it is 60.83 days. The difference of 12.16 days arises from the calculation basis and is not evidence that the company has changed its payment method.
Do not use inventory formulas solely for calculating credit purchases if the manufacturing business has various types of expenses, service transactions, returns, or specific adjustments. Detailed ledgers and method explanations should be used to ensure that the numerator and denominator reflect the same activity.
5 steps to calculate the number of days to pay from the accounts receivable ledger.
Define the range before substituting numbers into the formula. A spreadsheet with correct mathematical results can still be technically flawed if it includes accounts payable for the entire corporation but only purchases from a single company.
- Select the period and scope of the business. Record the start and end dates, reporting unit, currency type, and supplier group. For monthly/quarterly reports, use the data generated for that specific month/quarter and the corresponding number of days. Do not combine annual COGS with quarterly reports.
- Obtain the balance of trade payables. Reconcile the general ledger with the supplier's ledger at the beginning and end of the period. Do not include taxes payable, salaries payable, or loans in accounts payable. For internal transactions, separate them or treat them appropriately within the scope of consolidation to avoid double counting.
- Calculate the average amount payable. Take the sum of the beginning and ending balances and divide by 2. If the balances fluctuate significantly or are seasonal, consider averaging multiple monthly/daily points with appropriate time weights, then specify the method; the two points may not represent the entire period.
- Choose a number within the same range. Prioritize credit purchases that match the accounts payable data; if using COGS instead, specify the limit. Verify the currency and tax treatment to avoid comparing accounts payable including tax with the pre-tax purchase value without adjustment or explanation.
- Calculate DPO and cross-check. Divide the average debt by the denominator, then multiply by the number of days. Compare with the previous period using the same method; then check the contract terms, the age of the debt by due date, and the payment schedule. Round only the final result.
The number of days is not always 365. Monthly/quarterly reports may use the actual calendar number of days; annual reports use 365 or 366 if based on actual days. Some calculations, contracts, or analytical policies use a 360-day convention. If using a convention, clearly state it and maintain consistency when comparing, rather than subtly changing the calculation method.
The results should include at least four labels: period, debt range, denominator base, and averaging method. These labels help others to verify the data and avoid comparing two numbers with different definitions.
Examples of calculating DPO by quarter and by year.
Example for the quarter: credit purchases of 4 billion VND, DPO 27.3 days
Assume a trading business is analyzing a quarter with 91 days. Beginning trade liabilities are VND 1 billion, ending liabilities are VND 1.4 billion; the value of purchases on credit within the same scope during the quarter is VND 4 billion. All amounts are determined on the same basis and there are no out-of-bounds payables.
| Calculation step | Operation | Result |
|---|---|---|
| Average debt | (1 + 1.4) ÷ 2 | 1.2 billion VND |
| Average daily credit purchases | 4 billion ÷ 91 | Approximately 43.96 million VND per day |
| DPO of the quarter | (1.2 ÷ 4) × 91 | 27.3 days |
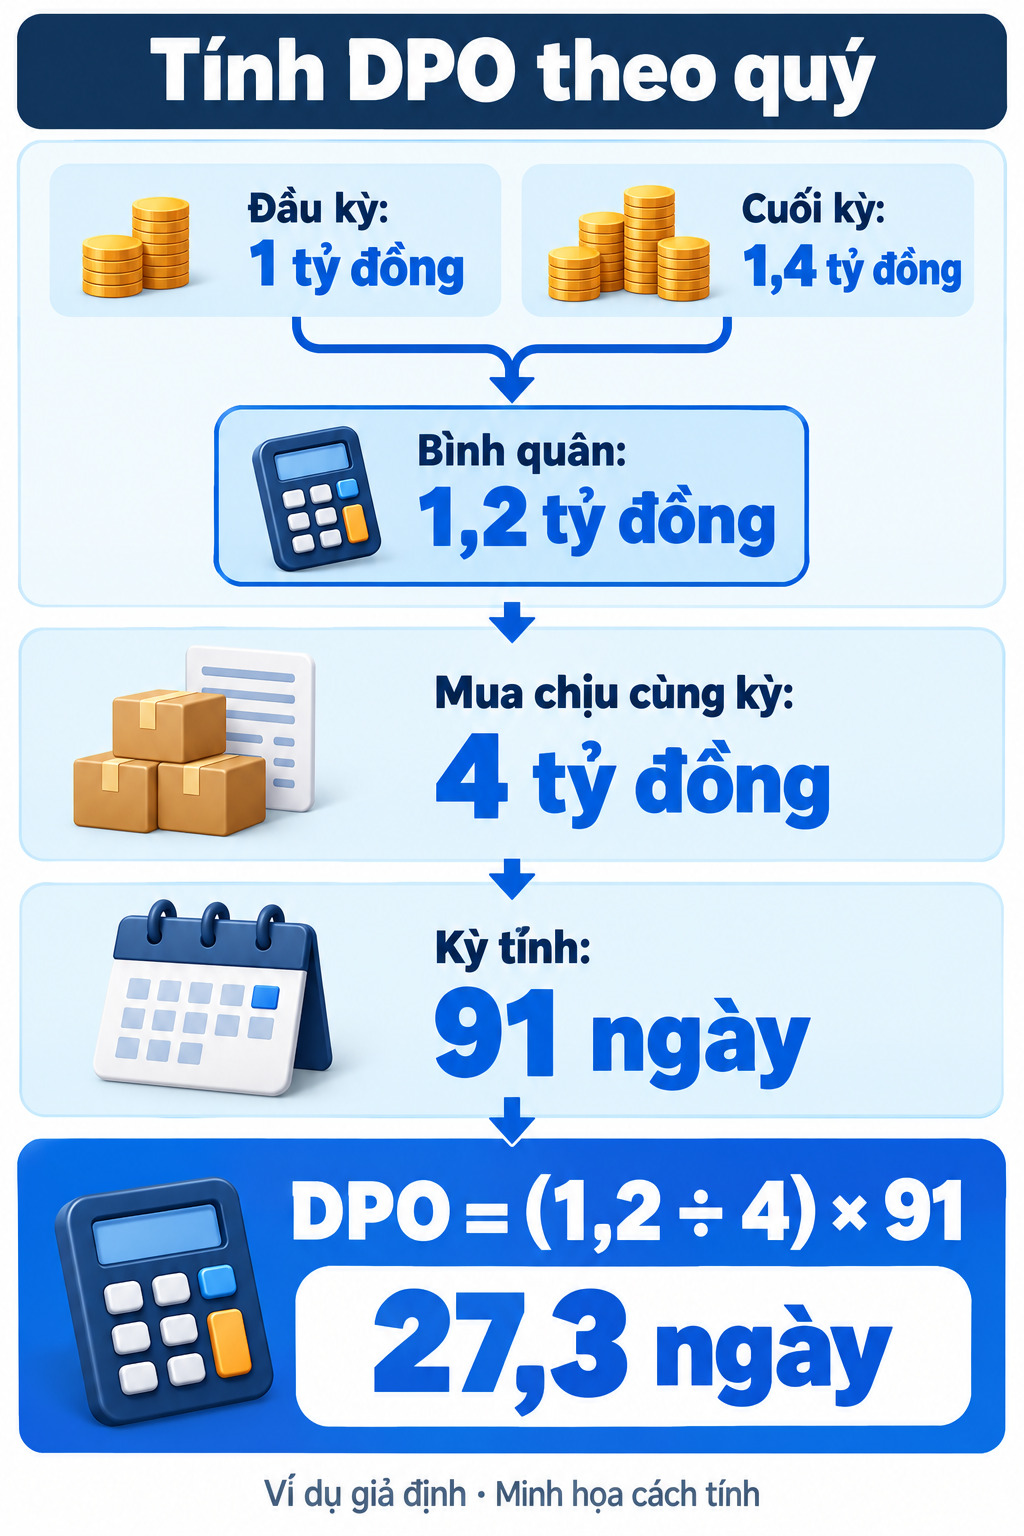
The DPO of 27.3 days is an aggregate estimate based on credit purchases for the quarter. It's impossible to conclude "early payment" without knowing whether the contracts are 15, 30, or 60 days and the corresponding purchase structure. Some invoices may still be overdue even with a low overall DPO for the entire company.
Example by year: keep the COGS calculation method but specify the limits.
With average payables of $50,000, annual COGS of $300,000, and a 365-day work schedule:
DPO according to COGS = (50,000 ÷ 300,000) × 365 = 60.83 days
Approximately 61 days may be presented when rounding is required in the report. This is the cost of goods sold result; do not automatically infer the actual payment time for each invoice. If inventory or the proportion of cash purchases is significant, check whether COGS represents credit purchases before using the results to make a decision.
When creating a spreadsheet, keep beginning and ending accounts payable, credit/COGS, and number of days as separate input cells. The DPO formula is easier to verify than a manually entered number; if the denominator is zero, write "cannot be calculated on this basis" and review the data, instead of assuming DPO equals zero.
How are accounts payable turnover and DPO related?
Accounts payable turnover is measured in the number of times a period is counted; DPO is measured in days. The two indicators are related when using the same debt scope, credit purchase denominator, and average method.
Accounts payable turnover = Purchases on credit during the period ÷ Average accounts payable
DPO = Number of days in the period ÷ Accounts payable turnover ratio
In the example above, the turnover is 4 ÷ 1.2 = 3.3333 turns/quarter. DPO = 91 ÷ 3.3333 ≈ 27.3 days. Do not divide 365 by the quarterly turnover: the result will be incorrect due to period discrepancies. Also, do not compare turnover based on credit purchases with DPO based on COGS as two equivalent calculations.
This cross-checking is useful for detecting unit errors, premature rounding, or the use of different denominators. Do not call “number of revolutions per day” DPO, as this term confuses the units and purposes of the two indicators.
High or low DPO: assessed by payment terms and overdue debt.
There is no single, optimal DPO level that applies to all businesses. The figures need to be interpreted in the context of the industry, bargaining power, purchasing structure, payment terms, discounts, and cash flow.
| Situation | Hypothesis to be tested | Confirmation data |
|---|---|---|
| DPO increased, on-time payments remained stable. | The terms were extended or the supplier structure changed. | New contract, purchase proportion by payment term, value of overdue debt. |
| DPO increases, overdue debt increases. | Lack of funds, slow approvals, or invoice reconciliation issues. | Cash forecasts, pending bill lists, and debt aging by payment due date. |
| DPO decreases, receive payment discount. | Businesses proactively make early payments. | The actual discount received, cash needed, and cost of capital. |
| DPO decreased without clear benefits. | Shorter terms or early repayment are customary. | Payment schedule, supplier terms and conditions, and cash purchase data. |
These are lines of inquiry, not automatic conclusions. An increase in DPO could also be due to a decrease in the denominator, seasonality, or a change in the calculation basis. The impact of data should be separated from changes in payment behavior before proposing solutions.
Comparison with industries requiring the same definition and at the same time.
When using an industry benchmark, examine five data points, business model, average or ending accounts receivable, co-payments (COGS), and the conventional number of days. A retail business and a service business may not be suitable for direct comparison. Do not set a 30–60 day target simply because a document states that range.
Comparing with the company's own history is usually easier to control, but adjustments are still needed when changing billing policies, purchasing structures, or consolidation scope. A 45-day DPO might be suitable for a 60-day contract group and requires investigation for a 30-day contract group; determining overdue payments requires going down to each individual invoice.
Holding cash for longer requires balancing the discount rate and the supply.
Paying early to receive a discount may result in a lower DPO (Deposit Per Order) but offers economic benefits. Conversely, delaying payment beyond the agreed terms may lead to the loss of the discount, affecting pricing or delivery terms. Compare the discount received with the cost of holding/borrowing money, and consider the importance of the supplier.
In working capital management, DPO is also part of the cash conversion cycle: CCC = DSO + DIO − DPO. This relationship provides context, but it doesn't mean that increasing DPO in every way will be better; inventory and accounts receivable can change simultaneously.
What to do when DPO changes unusually?
Start by comparing the data, then check the process and the ability to pay. Adjusting the formula correctly only fixes the reporting metrics; it doesn't automatically resolve overdue invoices.
- Check for consistency. Compare the period, currency, tax base, type of liability, and denominator. Check for large ending transactions, inventory changes, or centralized payments that may be distorting the average between the two periods.
- Create a list of invoices by due date. Separate invoices into those that are not yet due, overdue, and under dispute; note the reason for the delay. The invoice receipt date, approval date, and payment date help identify the delayed stage.
- Classify the causes. Missing documents or discrepancies in invoices require verification; approval issues require identifying the responsible party; liquidity shortages require forecasting cash flow and discussing terms with suppliers.
- Payment schedule will be finalized by agreement. Prioritize due obligations and key suppliers; evaluate discounts before opting for early payment. If an extension is necessary, negotiate clear terms instead of deliberately delaying payment.
- We'll revisit this in the next installment. Read the DPO along with the overdue debt, on-time ratio, and effective discount. Keep the metric definitions to know whether the change is due to operations or calculation.
When the problem lies with invoices awaiting reconciliation or approval, you can find more information about... Automate the accounts payable process. To understand the data stages that need to be organized, the tool is only useful when the data scope and processing responsibilities are defined; software should not be assumed to automatically calculate DPO accurately or guarantee timely payments.
Frequently Asked Questions about Calculating the Number of Days to Pay
Can we use the ending balance instead of the average balance?
Some reports use ending balances due to data limitations. The methodology should be clearly stated, and results should not be considered entirely equivalent to beginning/ending averages. If payments are centralized or seasonal, ending balances may result in less representative results.
Does DPO specify exactly which bills are overdue?
No. DPO is an aggregate estimate. To determine if an invoice is overdue, you need to check the due date, the amount owed, the payment date, and any adjustments or disputes related to the invoice itself.
What should we understand if DPO is negative or the denominator is zero?
A denominator of zero renders the formula undefined. Negative results may relate to mismatched recorded balances, advances, or adjustments; reconciliation of ledgers and scope is necessary before interpretation, and should not be taken as an indicator of efficiency.
What is the difference between DPO and DSO?
DPO tracks payments made by businesses to suppliers; DSO tracks payments made by customers to businesses. These two indicators use different accounts receivable and operational data and do not replace accounts receivable in the DPO formula.
References: ACCA: Working Capital Management Regarding database and analytical limitations; CFA Institute: Cash Conversion Cycle Regarding average debt and working capital context. The numerical examples in this article are hypothetical and illustrative, not industry benchmarks.